Smart Alarms
Smart Alarms are a powerful alternative to traditional building management system (BMS) alarms. Instead of reacting to a single threshold breach at a single moment in time, Smart Alarms aggregate sensor data over a configurable time window and trigger only when the aggregated result meets your condition.
This makes them ideal for detecting slow-developing faults, stuck equipment, and abnormal patterns that point-in-time alarms simply cannot catch.
Why Smart Alarms?
Traditional BMS alarms work on instantaneous values — "if temperature > 25 °C, trigger alarm". This approach has fundamental limitations:
| Traditional BMS alarm | Smart Alarm | |
|---|---|---|
| Trigger | Single value crosses threshold | Aggregated value over time window crosses threshold |
| False positives | High — brief spikes trigger alarms | Low — transient spikes are smoothed out |
| Stuck equipment | Cannot detect | Detects via sustained min/max/avg |
| Trend detection | Not possible | Relative change compares periods |
| Scope | Single data point | Multiple data points, filtered by type, unit, or system |
Core idea
A traditional alarm asks: "Is this value bad right now?" A Smart Alarm asks: "Has the pattern of values been bad over the last N minutes?"
Real-world example: stuck heating manifold
A heating manifold valve should modulate between 0 % and 100 % throughout the day in response to demand. If the valve has been open at 100 % for 24 hours straight, it is almost certainly stuck — but a traditional BMS alarm would never fire, because 100 % is within the normal operating range.
With a Smart Alarm you can define:
If the minimum value of the valve position is greater or equal to
99within1440 min(24 h) — trigger a Fault alarm.
Because the aggregation checks the minimum over 24 hours, the alarm only fires when the valve has never dropped below 99 % during the entire window — a clear indicator of a stuck valve.
This type of detection is impossible with traditional point-in-time alarms. The valve reading of 100 % is perfectly normal at any given moment — it only becomes a problem when it never changes.
More examples
| Scenario | Aggregation | Operator | Value | Interval | Priority |
|---|---|---|---|---|---|
| Stuck heating valve | min | >= | 99 | 1440 min (24 h) | Fault |
| Room overheating trend | avg | > | 26 | 60 min | Warning |
| Sensor stopped reporting | count | == | 0 | 30 min | Error |
| Sudden consumption spike | relative change | > | 30 (%) | 60 min | Warning |
| Freezing risk in pipe shaft | min | < | 5 | 120 min | Fault |
Accessing Smart Alarms
Open the site you manage, then navigate to Automation and select Smart Alarms & Predictive Maintenance.
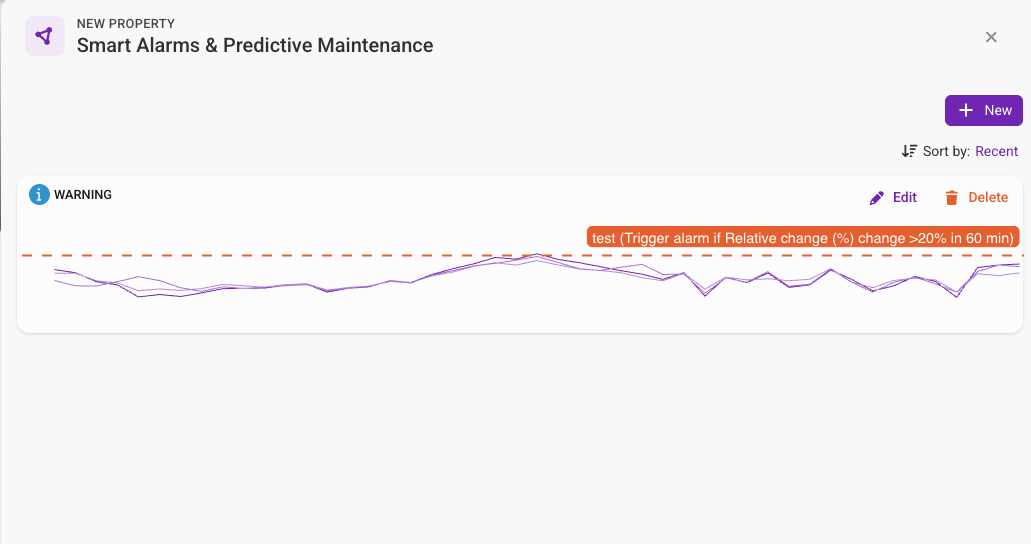
Configuring an aggregation alarm
Step 1 — Name and priority
Give the alarm a descriptive name (e.g. "AHU-1 supply fan stuck") and select a priority level:
| Priority | Severity | When to use |
|---|---|---|
| Warning | Low | Anomaly worth monitoring, no immediate action needed |
| Anomaly | Medium | Unusual pattern detected, investigate when possible |
| Error | High | Malfunction affecting system operation |
| Fault | Critical | Serious failure requiring immediate attention |
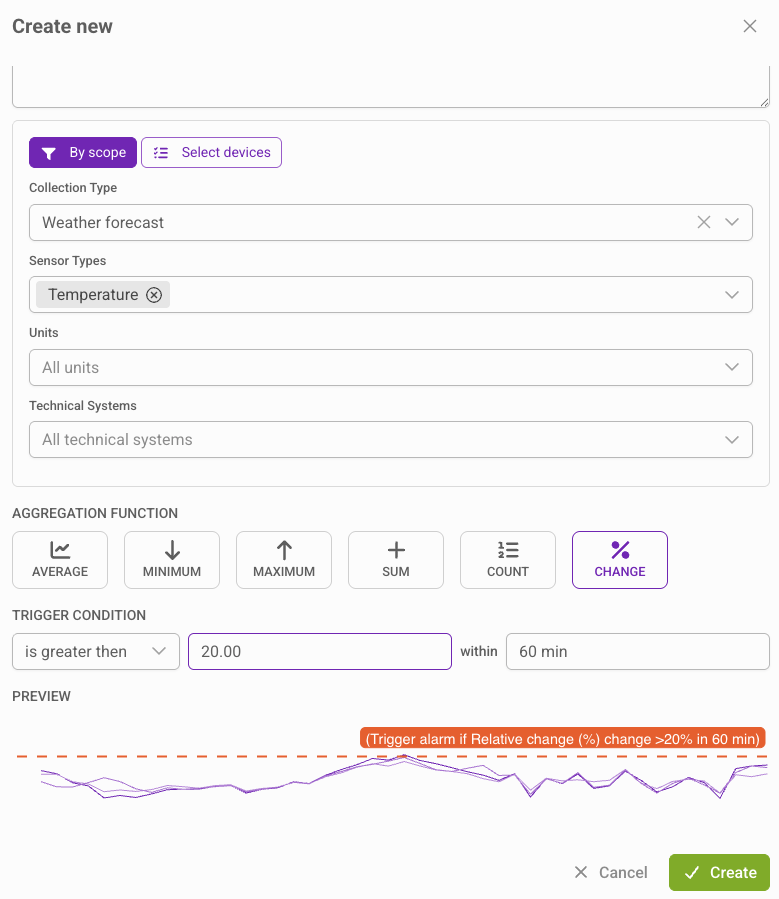
Step 2 — Define scope (measurement devices filter)
The scope determines which data points the alarm monitors. You can combine multiple filters — each filter rule is evaluated independently and contributes matching data points.
Specific data points
Select individual measurement devices by ID. Use this when you want to monitor a specific sensor or actuator — for example, a particular valve position or a specific temperature sensor.
Filter by type
Match data points by collection type (climate, analytics, meter, consumption) and measurement device type (temperature, humidity, power, etc.). This automatically includes all current and future sensors that match the criteria.
You can optionally narrow the filter further:
- Space — restrict to data points within a specific building space (floor, zone, apartment)
- Technical system — restrict to data points belonging to a specific technical system (e.g. only the AHU-1 ventilation unit)
Using type-based filters is recommended when you want the alarm to automatically cover new sensors as they are added to the building. For example, filtering by climate → temperature will monitor all temperature sensors, including ones connected in the future.
Step 3 — Choose aggregation function
The aggregation function determines how sensor values within the time window are combined before the trigger condition is evaluated.
| Function | Description | Use case |
|---|---|---|
Average (avg) | Mean of all values in the window | Sustained overheating, average power draw too high |
Minimum (min) | Lowest value in the window | Stuck valve (minimum never drops), freezing risk |
Maximum (max) | Highest value in the window | Peak voltage exceeding safe limits |
Sum (sum) | Total of all values in the window | Cumulative energy or water usage over a period |
Count (count) | Number of data samples in the window | Detect sensors that stopped reporting (count == 0) |
Relative change (relative_change) | Percentage change compared to the previous window of the same length | Sudden consumption spike, demand shift detection |
Relative change compares the average of the current window with the average of the previous window of the same length. A value of 30 means a 30 % increase. This is useful for detecting sudden shifts rather than absolute levels.
Step 4 — Set trigger condition
The trigger condition defines when the aggregated value should fire an alarm:
- Operator — how to compare:
>,>=,<,<=,==,!= - Value — the threshold to compare against
- Interval — the time window in minutes (from 5 min up to 1440 min / 24 h)
For example: avg > 26 within 60 min means "if the average exceeds 26 over any 60-minute window, trigger the alarm".
Step 5 — Preview and save
Before saving, the configuration form shows a live chart preview plotting the last 48 hours of data from your selected scope. The trigger threshold is displayed as a red dashed line so you can visually verify that your condition makes sense against real data.
If the preview shows "No samples reported within last 48 hours", verify that your scope filter matches active data points.
How Smart Alarms run
Once saved, the platform evaluates your alarm definition on a recurring schedule (every 5 minutes). The system:
- Identifies all matching measurement devices from your scope filter
- Queries the time-series database for the configured time window
- Applies the aggregation function to each device's data
- Compares the result against the trigger condition
- Creates or resolves alarms per device accordingly
Alarms follow the same lifecycle as all platform alarms (Active → Resolved → Cleared) and appear in the Technical Systems alarm views, dashboards, and notifications.
Smart Alarm evaluation cycle
Best practices
- Start with longer intervals — A 60-minute window filters out noise better than 5 minutes. Shorten the interval only if you need faster detection.
- Use min/max for stuck equipment — If a valve or damper should modulate, a sustained min or max over hours indicates mechanical failure.
- Use count for connectivity monitoring —
count == 0 within 30 mininstantly detects sensors that stopped reporting data. - Use relative change for consumption anomalies — A 30 % spike compared to the previous period catches demand surges without requiring absolute thresholds.
- Combine with AI Alarm Analyzer — When a Smart Alarm triggers, the AI analyzer provides root-cause analysis using system context and uploaded documentation.
- Name alarms descriptively — Include the system name and fault type (e.g. "AHU-3 supply temp stuck high") so operators can act without investigating.