Getting Started as a Manager
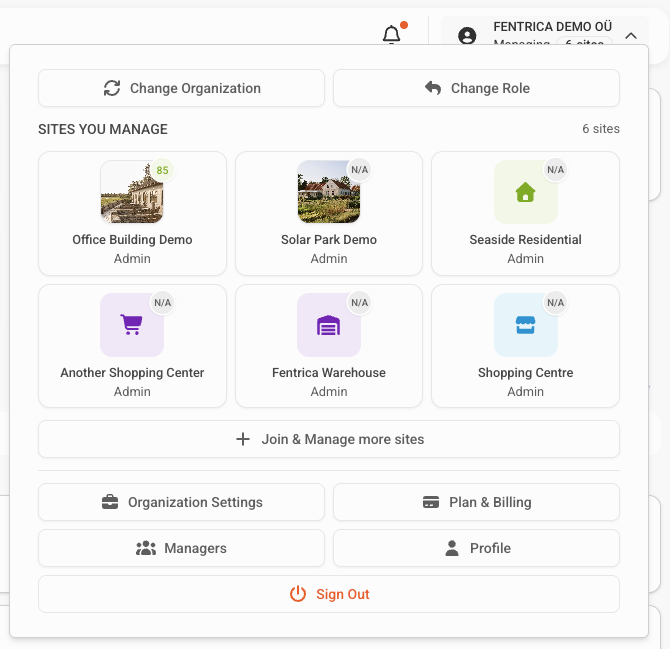
As a manager, your dashboards aggregate data from all the sites you manage into a single view. Instead of switching between individual buildings, you see combined KPIs, trends, and action items across your entire portfolio.
Logging in
- Open app.fentrica.com in your browser
- Sign in with your credentials
- Select your organization
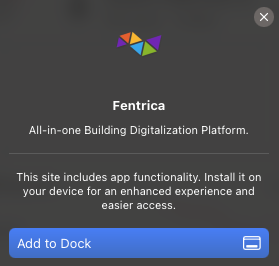
Install the app
Fentrica is a Progressive Web App. You can install it for quick access:
- Open app.fentrica.com and sign in
- Your browser will show an Install prompt
- Tap Install or Add to Home Screen
On iOS Safari, tap the Share button and select Add to Home Screen.
Dashboards
Dashboards are the central hub for your daily operations. After logging in, the platform shows your dashboards — each one designed to give managers a real-time overview of what's happening across all managed sites. Instead of opening each site individually, dashboards aggregate data from every site you have joined and present it as KPIs with trend comparisons, filterable resource lists, and quick actions.
- Energy — Monitor energy consumption, costs, carbon footprint, energy flow across sites, and identify optimization opportunities. Learn more
- Access — Oversee access policies, tenant credentials, cards, license plates, security events, and authorization activity. Learn more
- Maintenance — Track incoming maintenance requests, active work orders, service provider assignments, deadlines, and tenant satisfaction. Learn more
- Systems — Monitor building system health, alarm activity, reliability metrics, and preventive maintenance coverage. Learn more
Each KPI card shows the current value, a trend comparison against a previous period (last week, last month, or last year), and an action link to drill into the underlying data. Clicking a KPI opens the relevant resource list pre-filtered to the items that need attention.
If you haven't joined any sites yet, the dashboard shows an empty state with a link to browse available sites.
Site view
While dashboards aggregate data across all your sites, the site view lets you manage a single site in detail. Open any site to access its full configuration — spaces, technical systems, service providers, preventive maintenance plans, automation rules, SmartDocs, and settings.
On mobile, sites are accessible from the top navigation menu. On desktop, your joined sites appear in the left sidebar for quick switching — tap any site to open its detail view. You can also access sites from the Sites page in the navigation.
The site view is organized into tabs:
- Overview — Pinned smart spaces and technical systems marked for dashboard visualization
- Management — Day-to-day operations: preventive maintenance, service providers, SmartDocs
- Smart Spaces — Browse and control individual units and spaces
- Site Data — Consumption dashboards, sensor data, weather, and analytics
- Automation & AI — Integration apps, smart alarms, AI agents, energy optimizers, schedules
- Settings — Spaces, edge devices, measurement devices, technical systems, site managers
Each technical system has its own configuration page accessible from Settings → Technical Systems (or via the Settings button on the system's detail modal). There you can edit identity fields (name, type, manufacturer, schedule, expected life, etc.) and assign Service Providers who are responsible for the system. See Service Providers for what that assignment grants.
Filters and search
Each dashboard has resource tabs (e.g., users, policies, work orders, alarms) that list items in a table. These tables support filtering and search to help you find what you need:
- Search — Type keywords to find specific resources (e.g., a user name, policy name, or alarm source)
- Filters — Narrow the table by site, status, date range, or other attributes depending on the resource type
Filters can be combined and are shown above the table. Clear them individually or all at once to return to the full view.
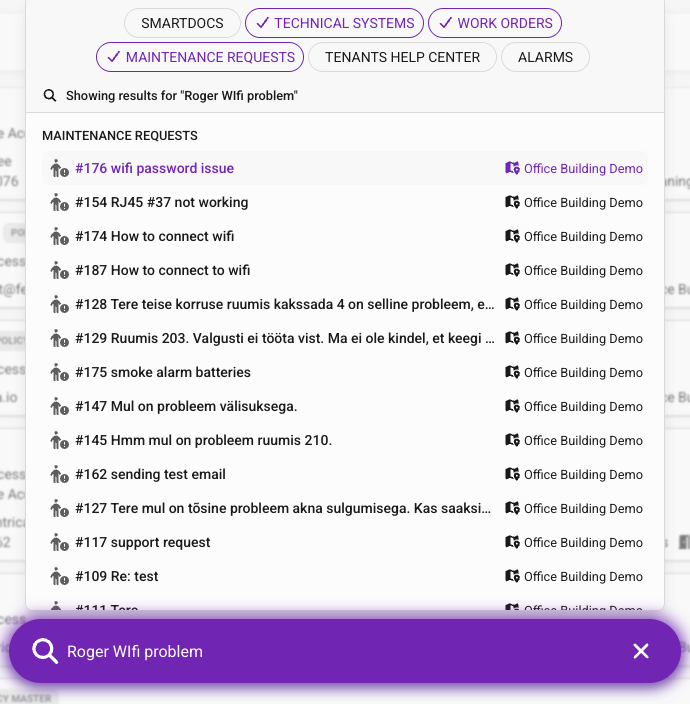
Global search
The platform includes an AI-powered global search accessible from the top navigation bar. Unlike table filters that work within a single resource type, global search lets you find anything across your entire organization — users, policies, work orders, alarms, technical systems, and more.
Type a natural language query and the search understands your intent, returning relevant results from all dashboards and sites.
How to join a site
- Open the Sites page from the navigation
- Browse the list of available sites in your organization
- Tap Join on the site you want to manage
- Depending on the site's privacy level, you are either added immediately or placed in a pending state
Site privacy levels
Each site has a privacy level that controls how managers can join:
- Public (Unrestricted) — Any manager in the organization can join immediately and start managing the site
- Private (Restricted) — Managers can request to join, but a site admin must approve the request before access is granted
For private sites, your status shows as Pending until the site admin approves your request.
Notifications
When something requires your attention — a new alarm, a maintenance request, an access event — a notification appears at the top of the screen. This keeps you informed without needing to check each dashboard manually.
If you have installed the PWA app, Fentrica also sends native push notifications to your device, so you receive alerts even when the app is not open.
Some dashboards and features may not be available in your organization depending on your subscription plan. If a section is not visible, contact your organization admin to check which features are included in your current plan.