Technical Systems
The Technical Systems dashboard gives you a combined view of building infrastructure health across all your managed sites. It monitors system status, alarm activity, and reliability metrics.
KPIs
The dashboard tracks key indicators covering alarm activity by severity (faults, errors, warnings), system health (integration rate, operational percentage), preventive maintenance coverage, and reliability metrics such as MTTR, MTBF, and average system age. Each KPI card shows the current value with a trend comparison.
Key concepts
Technical System
A technical system represents a piece of building infrastructure — an HVAC unit, elevator, fire alarm, lighting controller, battery storage, access control system, or any other managed equipment.
Each system tracks its manufacturer, model, serial number, commissioning date, expected lifespan, and current operational status. Systems are linked to specific spaces within a building and can have measurement devices, data points, and maintenance schedules attached.
Alarms
Alarms are generated when a system or sensor crosses a configured threshold or enters an abnormal state. Each alarm has a priority level and a lifecycle state.
Alarm priority levels:
| Priority | Severity | Meaning |
|---|---|---|
| Fault | Critical | A serious failure requiring immediate attention |
| Error | High | A malfunction that affects system operation |
| Warning | Low | An anomaly that should be monitored |
Alarm lifecycle:
Alarm lifecycle
- Active — the alarm condition is ongoing
- Resolved — the condition has cleared but the alarm has not been acknowledged
- Cleared — the alarm has been reviewed and closed
Technical system view
When you open a technical system, you see a detailed view of that piece of equipment with everything you need to monitor, control, and maintain it.
Overview
The overview tab shows the system's identity and current state: manufacturer, model, serial number, commissioning date, expected lifespan, and time remaining. It also highlights open maintenance tasks with their deadlines and assigned personnel, as well as active alarms with the most recent alarm details including severity, source, and duration.
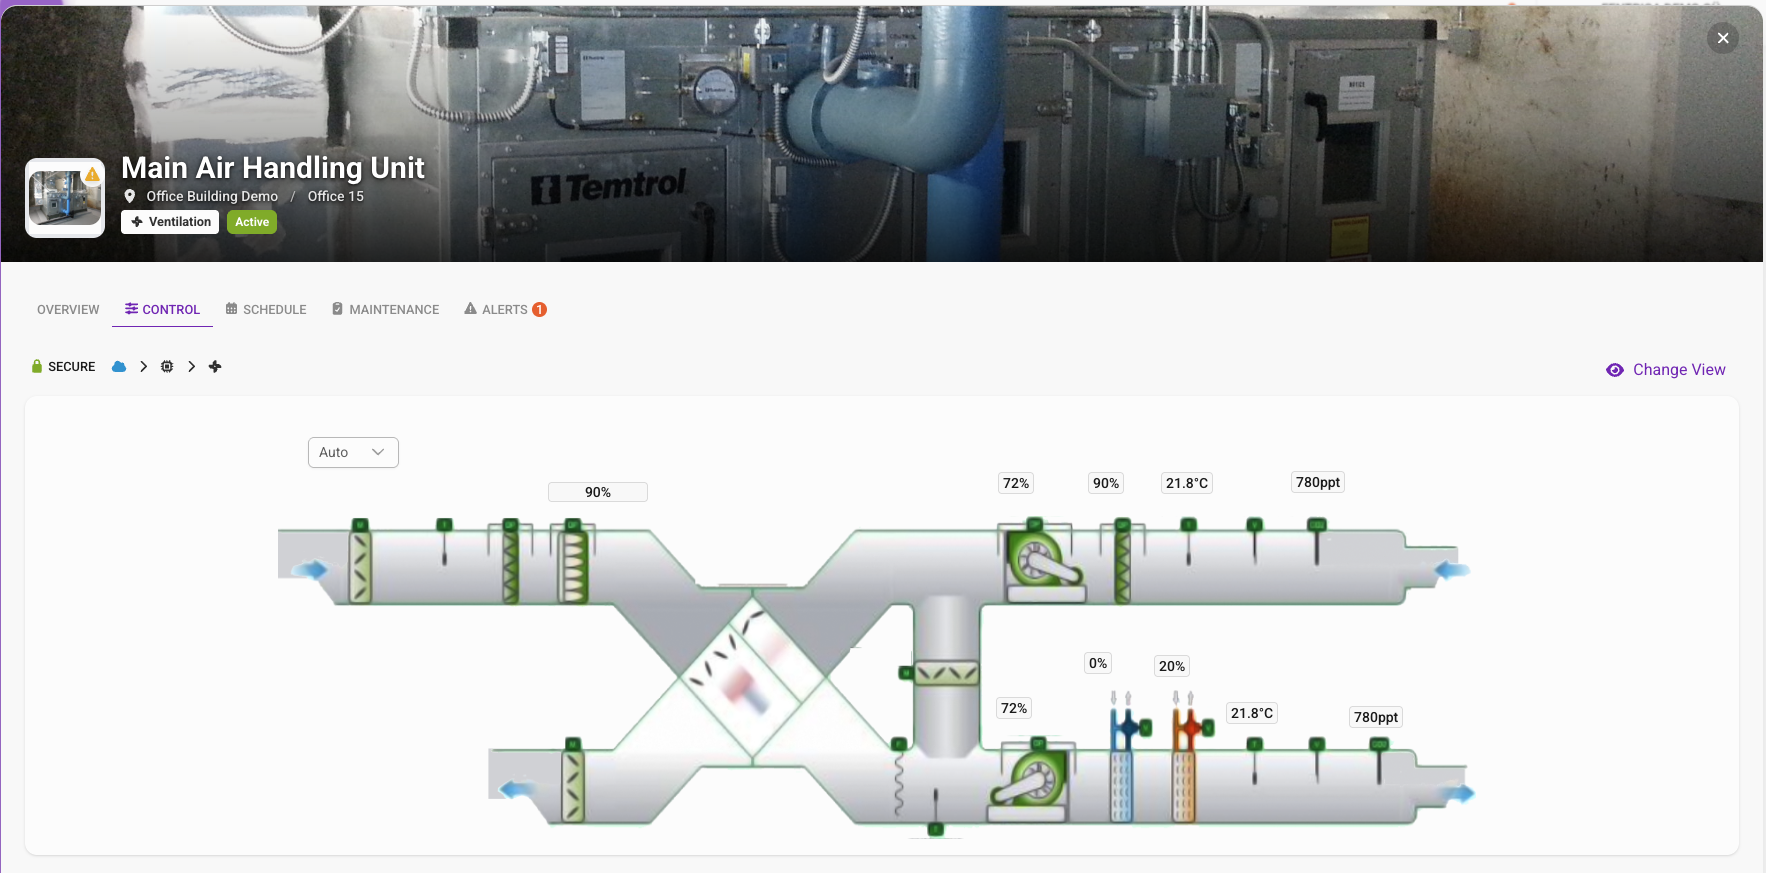
Control
Real-time control of the system. View live data points and adjust setpoints directly from the platform.
Schedule
AI-powered and rule-based energy optimizations managed by the Fentrica platform. Schedules define when and how the system operates, including setpoint adjustments to optimize energy consumption.
Maintenance
Maintenance journal, service history, and O&M (Operations & Maintenance) documentation for the system. Tracks all past and planned maintenance activities in one place.
Upload technical system documentation here — manufacturer manuals, datasheets, service guides, and troubleshooting references. Attaching documents directly to the technical system allows the AI Alarm Analyzer to reference the correct documentation when analyzing alarms for this specific equipment, providing more accurate and relevant recommendations.
Alerts
Alarm history and active alarms for the system, including faults, errors, and warnings. Each alarm entry shows severity, source, timestamp, and resolution status.
AI Alarm Analyzer
When an alarm occurs, the AI analyzer examines the alarm details, system context, and historical patterns to provide an explanation of what likely caused the issue and how to resolve it. The AI also uses your uploaded technical documentation, user manuals, and O&M materials to provide more precise and contextual insights.
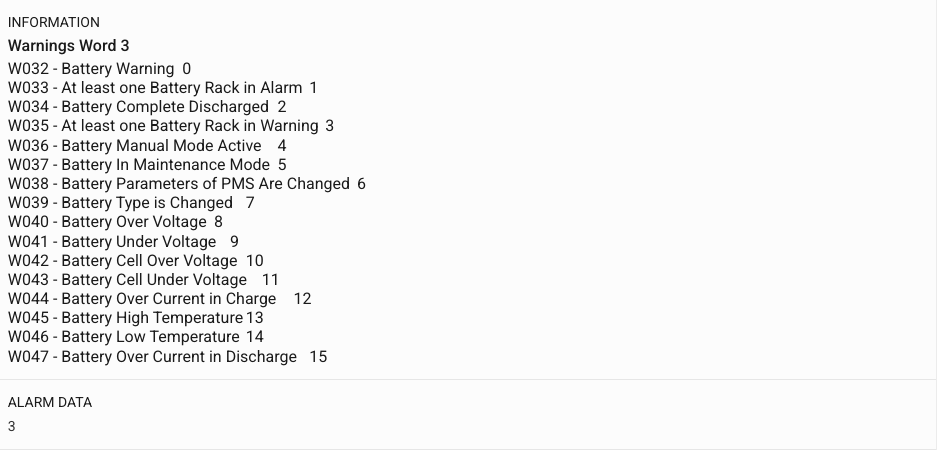
Alarm details
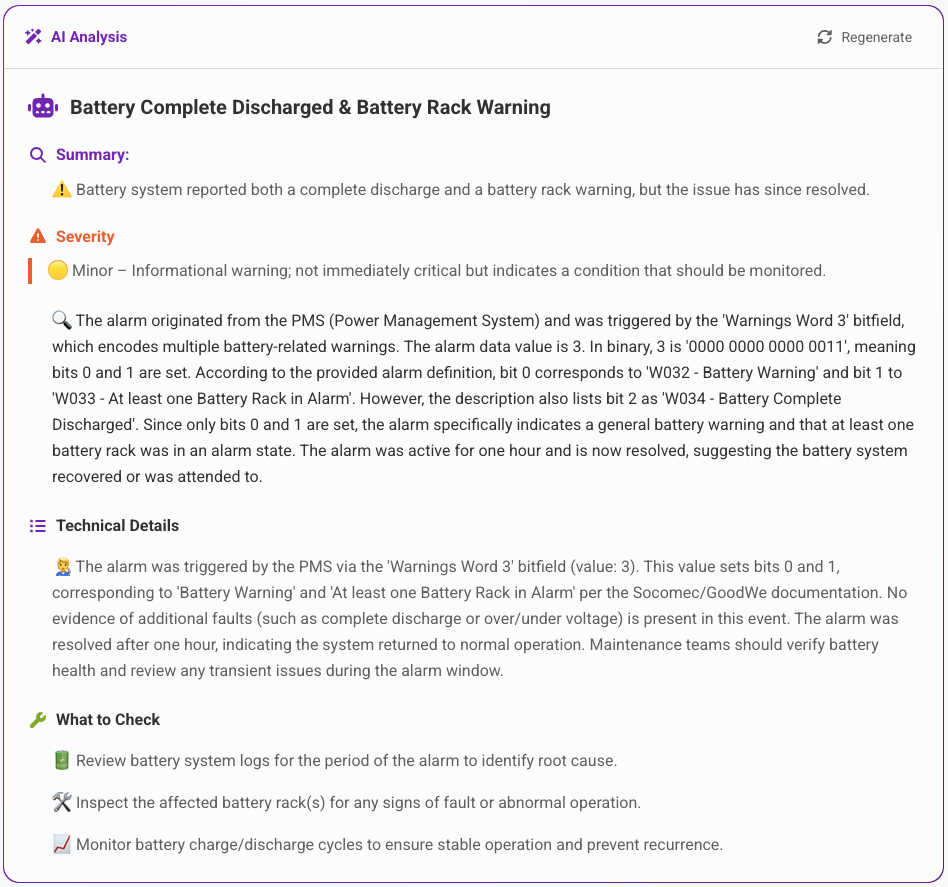
AI analysis
Dashboard tabs
- Alarms — All alarms across your sites, filterable by priority, state, source, date, and site
- Technical Systems — All registered systems, filterable by type, status, and site
Available Quick actions
New Maintenance Work Order
Create a task to address an alarm or system issue.